Tableau to Power BI Migration
The Pulse Convert Enterprise Framework
AI-Powered Accelerator & Complete Enterprise Guide
Pulse Convert is an AI-powered Tableau to Power BI migration accelerator developed by Office Solution AI Labs. It automates dashboard conversion with 75-90% initial accuracy, reducing months of manual effort to minutes.
Designed for enterprise-scale BI modernization, Pulse Convert:
- Converts dashboards, visuals, filters, and calculations
- Maps Tableau LOD expressions to optimized DAX
- Rebuilds semantic models in Power BI
- Preserves data logic and relationships
- Requires only 12-25% manual fine-tuning depending on complexity
Pulse Convert leverages our in-house trained LLM, “Pulse,” to intelligently interpret Tableau logic and translate it into structured Power BI semantic models and DAX measures.

What is Tableau to Power BI Migration?
Tableau to Power BI migration is the strategic process of transitioning an organization’s business intelligence (BI) infrastructure, data models, and visualization dashboards from Salesforce’s Tableau to Microsoft’s Power BI.
Companies often initiate this migration to leverage Power BI’s deep integration with the Microsoft 365 and Azure ecosystems, realize cost efficiencies, or simplify their tech stack within a Microsoft-centric environment.
Why Enterprises Are Moving from Tableau to Power BI
Modern organizations are accelerating their Tableau to Power BI migration to slash costs, unify their data stack, and unlock AI-driven insights. Here is why Power BI is the strategic choice for 2026.
1. Massive TCO Reduction & Licensing Flexibility
Power BI offers a significantly lower Total Cost of Ownership (TCO) compared to other BI tools.
- Scalable Pricing: Choose between per-user (Pro/PPU) or capacity-based (Fabric) licensing based on your needs.
- Ecosystem Bundling: Utilize existing Microsoft 365 or Azure investments to reduce additional BI costs.
- Reduced Overhead: Eliminate the need for dedicated third-party infrastructure and simplify management.
Together, these advantages make Power BI a cost-efficient and practical choice for modern businesses.
Whether it’s flexible pricing, seamless integration with existing tools, or reduced infrastructure needs, organizations can streamline their analytics setup while keeping costs under control.
This allows teams to focus less on managing systems and more on making data-driven decisions.
2. Seamless Microsoft Ecosystem Integration
Power BI integrates natively with:


Power BI isn't just a tool; it’s a native extension of the world's most used business apps.
- Collaborative Data: Share live reports directly within Microsoft Teams and PowerPoint.
- Excel Continuity: Maintain a single source of truth with "Analyze in Excel" features.
- Fabric Foundation: Connect directly to Microsoft Fabric and OneLake for unified data engineering.
3. Enterprise-Grade Governance & Security
Consolidate your security posture by moving analytics into the Microsoft cloud.
- Unified Identity: Manage access via Microsoft Entra ID (formerly Azure AD).
- Precision Security: Implement Row-Level Security (RLS) to ensure users see only the data they are authorized to view.
- End-to-End Lineage: Track data from the source to the final visual for total auditability.
4. Future-Proofing with AI & Copilot
Transitioning to Power BI prepares your data estate for the GenAI era
- Microsoft Copilot: Use natural language to generate DAX, summaries, and entire report pages.
- Automated Insights: Leverage built-in AI visuals to detect anomalies and identify key business influencers automatically.
5. Scalable Cloud Architecture
Modernize your data workflows with a platform built for the cloud.
- Direct Lake Performance: Get the speed of "Import" with the freshness of "DirectQuery."
- Elastic Scaling: Dynamically adjust compute power as your enterprise analytics needs grow.
Tableau vs. Power BI: At a Glance
| Feature | Tableau | Microsoft Power BI |
|---|---|---|
| Best For | Complex data, high-end visuals, & large datasets | Business users, Excel fans, & MS ecosystem |
| Learning Curve | Steeper; requires training for advanced work | Intuitive; familiar "Office" feel |
| Pricing | Premium ($70/user/month for Creator) | Budget-friendly ($10/user/month for Pro) |
| Visual Flexibility | Extremely high; "canvas" style design | Moderate; more structured/template-based |
| Data Handling | Excellent for billions of rows (Hyper engine) | Great for mid-sized; can lag on massive data |
| OS Support | Windows & Mac | Windows only (Desktop version) |
| Integration | Salesforce, Slack, AWS, Snowflake | Azure, Excel, Teams, SQL Server |
Key Differences Between Tableau and Power BI
1. User Experience & Learning Curve
If you are comfortable with Excel, Power BI will feel like home. It uses a ribbon interface and a similar logic for formulas (DAX). Most users can build their first dashboard within hours.
Tableau software, on the other hand, is built for the "data explorer." It uses a drag-and-drop shelf system that offers far more freedom but takes time to master. If you want a "pixel-perfect" dashboard where every line and color is customized, Tableau is the winner.
2. Visual Storytelling and Analytics
Tableau BI is widely considered the gold standard for data visualization. It allows you to create complex, multi-layered charts that Power BI simply can’t replicate without custom coding. It excels at spatial analysis and discovery-driven analytics.
Power BI focuses on "operational" reporting—getting the numbers to the right people quickly. While it has a huge library of custom visuals, it is more rigid in its layout.
3. The Cost Factor
Pricing is often the deciding factor. Power BI is the "value" choice. Many companies already have it included in their Microsoft 365 E5 licenses. At $10 per month for a Pro license, it’s hard to beat for small to mid-sized businesses.
Tableau is a significant investment. With a Creator license starting at $70 per month (billed annually), it is usually reserved for dedicated data analysts and enterprises that need its heavy-duty processing power.
4. Data Connectivity
Both tools connect to almost everything (SQL, Excel, SAP, Google BigQuery). However, Tableau is more "vendor-neutral." It plays well with every cloud provider. Power BI is naturally optimized for the Microsoft Azure stack, making it the lightning-fast choice if your data already lives in the Microsoft cloud.
The 5-Step Technical Transition Architecture
Our proprietary framework ensures a high-fidelity migration by deconstructing Tableau's metadata and intelligently reconstructing it within the Power BI ecosystem.
1. Estate Discovery & Asset Rationalization
Enterprise BI environments often carry 30% “Technical Debt” in the form of obsolete content. Before moving data, we perform a deep-dive audit using the Tableau Server Repository (PostgreSQL) and Metadata API.
This phase identifies “Ghost Reports”—assets with zero views in 90+ days or no active subscriptions. Rationalizing your environment at the source ensures you only invest in migrating high-value business intelligence, drastically reducing the final footprint in Power BI.
2. .TWB Metadata & XML Node Parsing
To maintain structural integrity, the migration framework must parse the Tableau XML schema (.TWB) at the node level. This process extracts raw connection strings, metadata aliases, and join logic directly from the source code.
By automating the extraction of this “connection layer,” we can map complex Tableau data sources—including blended data and cross-database joins—into a clean, unified Power BI Project (.PBIP) structure.
3. Logic Translation: LOD to DAX Mapping
The primary technical hurdle in any migration is the “logic gap.” Tableau's Level of Detail (LOD) expressions—FIXED, INCLUDE, and EXCLUDE—operate on a visualization-context level. Conversely, Power BI's DAX (Data Analysis Expressions) is model-centric.
Our framework uses a semantic mapping engine to translate these expressions into optimized CALCULATE, SUMMARIZE, and FILTER functions. This ensures that critical KPIs, such as Year-over-Year (YoY) growth and running totals, remain mathematically consistent post-migration.
4. Visual Porting & UX Familiarity Reconstruction
User adoption is the ultimate metric for success. The migration must translate the Tableau “Sheet” philosophy into the Power BI “Page” architecture while preserving original color hex codes and branding logic.
During this stage, we introduce Power BI-native enhancements, such as Bookmarks for advanced navigation and Tooltip Pages for deeper insights, modernizing the user experience without creating a steep learning curve for existing stakeholders.
5. Microsoft Fabric & Copilot Optimization
A 2026 migration must be future-proof. In the final phase, semantic models are optimized for OneLake integration and Direct Lake mode for near-instant performance on large datasets.
We also implement a “Copilot-Ready” metadata layer, including measure descriptions and synonym mapping, to ensure your organization is prepared for natural language querying and GenAI-driven insights from day one.
As Seen On


Mapping Tableau Logic to Power BI (Technical Deep Dive)
This is where most migrations fail. We ensure precise translation of complex logic.
Tableau Calculated Fields → DAX Measures
Mapping complex expressions requires semantic understanding to ensure business logic is preserved.
LOD Expressions → Aggregation & Context Handling
Power BI handles context differently than Tableau. We map Fixed/Include/Exclude to accurate DAX equivalents.
Data Extracts → Power BI Dataflows
ETL optimization is required to replace Tableau extracts with robust Power BI dataflows and datasets.
Tableau Server → Power BI Service Migration
- Access roles
- Refresh schedules
- Dataset permissions
Solving the “Logic Gap” in BI Modernization
Most migrations fail not because of visuals, but because of Calculation Logic. Tableau's XML-based .TWB structure and Power BI's .PBIP (Power BI Project) format handle data context differently. Pulse Convert is built to deconstruct the Tableau metadata layer, specifically addressing the transition from a “Visualization-First” tool to a “Model-First” ecosystem like Microsoft Fabric.
How Pulse Convert Automates Technical Mapping
Level of Detail (LOD) Conversion
We map Tableau FIXED, INCLUDE, and EXCLUDE expressions into optimized CALCULATE and SUMMARIZE DAX functions.
Semantic Model Reconstruction
Tableau often relies on “Data Blending.” Pulse Convert identifies these joins and suggests a Star Schema relationship in Power BI to ensure performance at scale.
Visual Fidelity & Metadata
Beyond just charts, we extract color hex codes, font styles, and filter logic to ensure your C-suite sees zero difference in report aesthetics.
Manual Migration vs. Automated Migration Tool
| Comparison | Manual Approach | Pulse Convert (Automated) |
|---|---|---|
| Timeline | 3-6 months | 6-16 Minutes |
| Effort | High manual effort | Minimal effort |
| Risk | Human error | AI-driven conversion |
| Cost | Expensive consultants | Cost-Effective |
| Accuracy | 50%-60% | 70%-90% |
| Data Loss Risk | High | Low / Secure |
| Business Continuity | High disruption | Minimal disruption |
Our proprietary Tableau to Power BI migration tool, Pulse Convert, accelerates dashboard transformation while maintaining structural integrity.


Why Choose Pulse Convert for Tableau to Power BI Migration?
Unlike traditional consulting firms, we combine AI automation with domain expertise to reduce migration time significantly. Our proprietary Tableau to Power BI migration tool, Pulse Convert, accelerates dashboard transformation while maintaining structural integrity.
Pulse Convert leverages our in-house trained LLM "Pulse" to intelligently interpret Tableau logic and convert it into optimized Power BI DAX and semantic models.

GenAI-Powered Automation

75%-90% Migration Accuracy

Enterprise Framework

Free 5-Dashboard POC

Relationship & Data Mapping

Enterprise-Scale Migration

Learning-Based Model
Backed by Microsoft
Common Tableau to Power BI Migration Challenges
Every migration project comes with technical obstacles. From complex LOD expressions to data model differences, manual conversion often leads to performance bottlenecks and logic errors. Pulse Convert addresses these challenges head-on with automated semantic mapping.
By automating the translation of calculated fields and data relationships, we eliminate the common pitfalls of manual redevelopment, ensuring that your new Power BI environment is optimized for performance, scalability, and user adoption from day one.

Complex LOD Expressions
Solution: Advanced DAX restructuringTableau LODs (Fixed, Include, Exclude) require advanced DAX restructuring to maintain accurate aggregation contexts in Power BI.

Performance Issues
Solution: Model optimizationDirect lift-and-shift often causes slow reports. We implement Star Schema modeling and rigorous performance tuning.

User Adoption Resistance
Solution: Phased rollout strategyWe ensure high user adoption through a phased rollout strategy, training, and maintaining visual familiarity in the new system.

Embedded Dashboards
Solution: API-based restructuringConverting embedded analytics requires API-based restructuring to seamless integration within your applications.
FAQs on Tableau to Power BI Migration

The timeline depends on dashboard complexity, number of reports, calculated fields, and data model structure. Manual migration can take weeks, while automated Tableau to Power BI migration tools can reduce the process to hours or days for most enterprise environments.
Most Tableau dashboards can be migrated with 75-90% structural and logic accuracy, depending on complexity. Advanced calculations, custom visuals, and LOD expressions may require validation and minor optimization after conversion.
A hybrid approach works best. Automated migration tools accelerate dashboard conversion, while manual validation ensures KPI accuracy, performance optimization, and business alignment. This reduces risk and saves significant time compared to full manual rebuild.
Enterprise-grade automation tools like Pulse Convert by Office Solution AI Labs are designed to streamline Tableau to Power BI migration with high accuracy, reduced manual effort, and structured governance support.
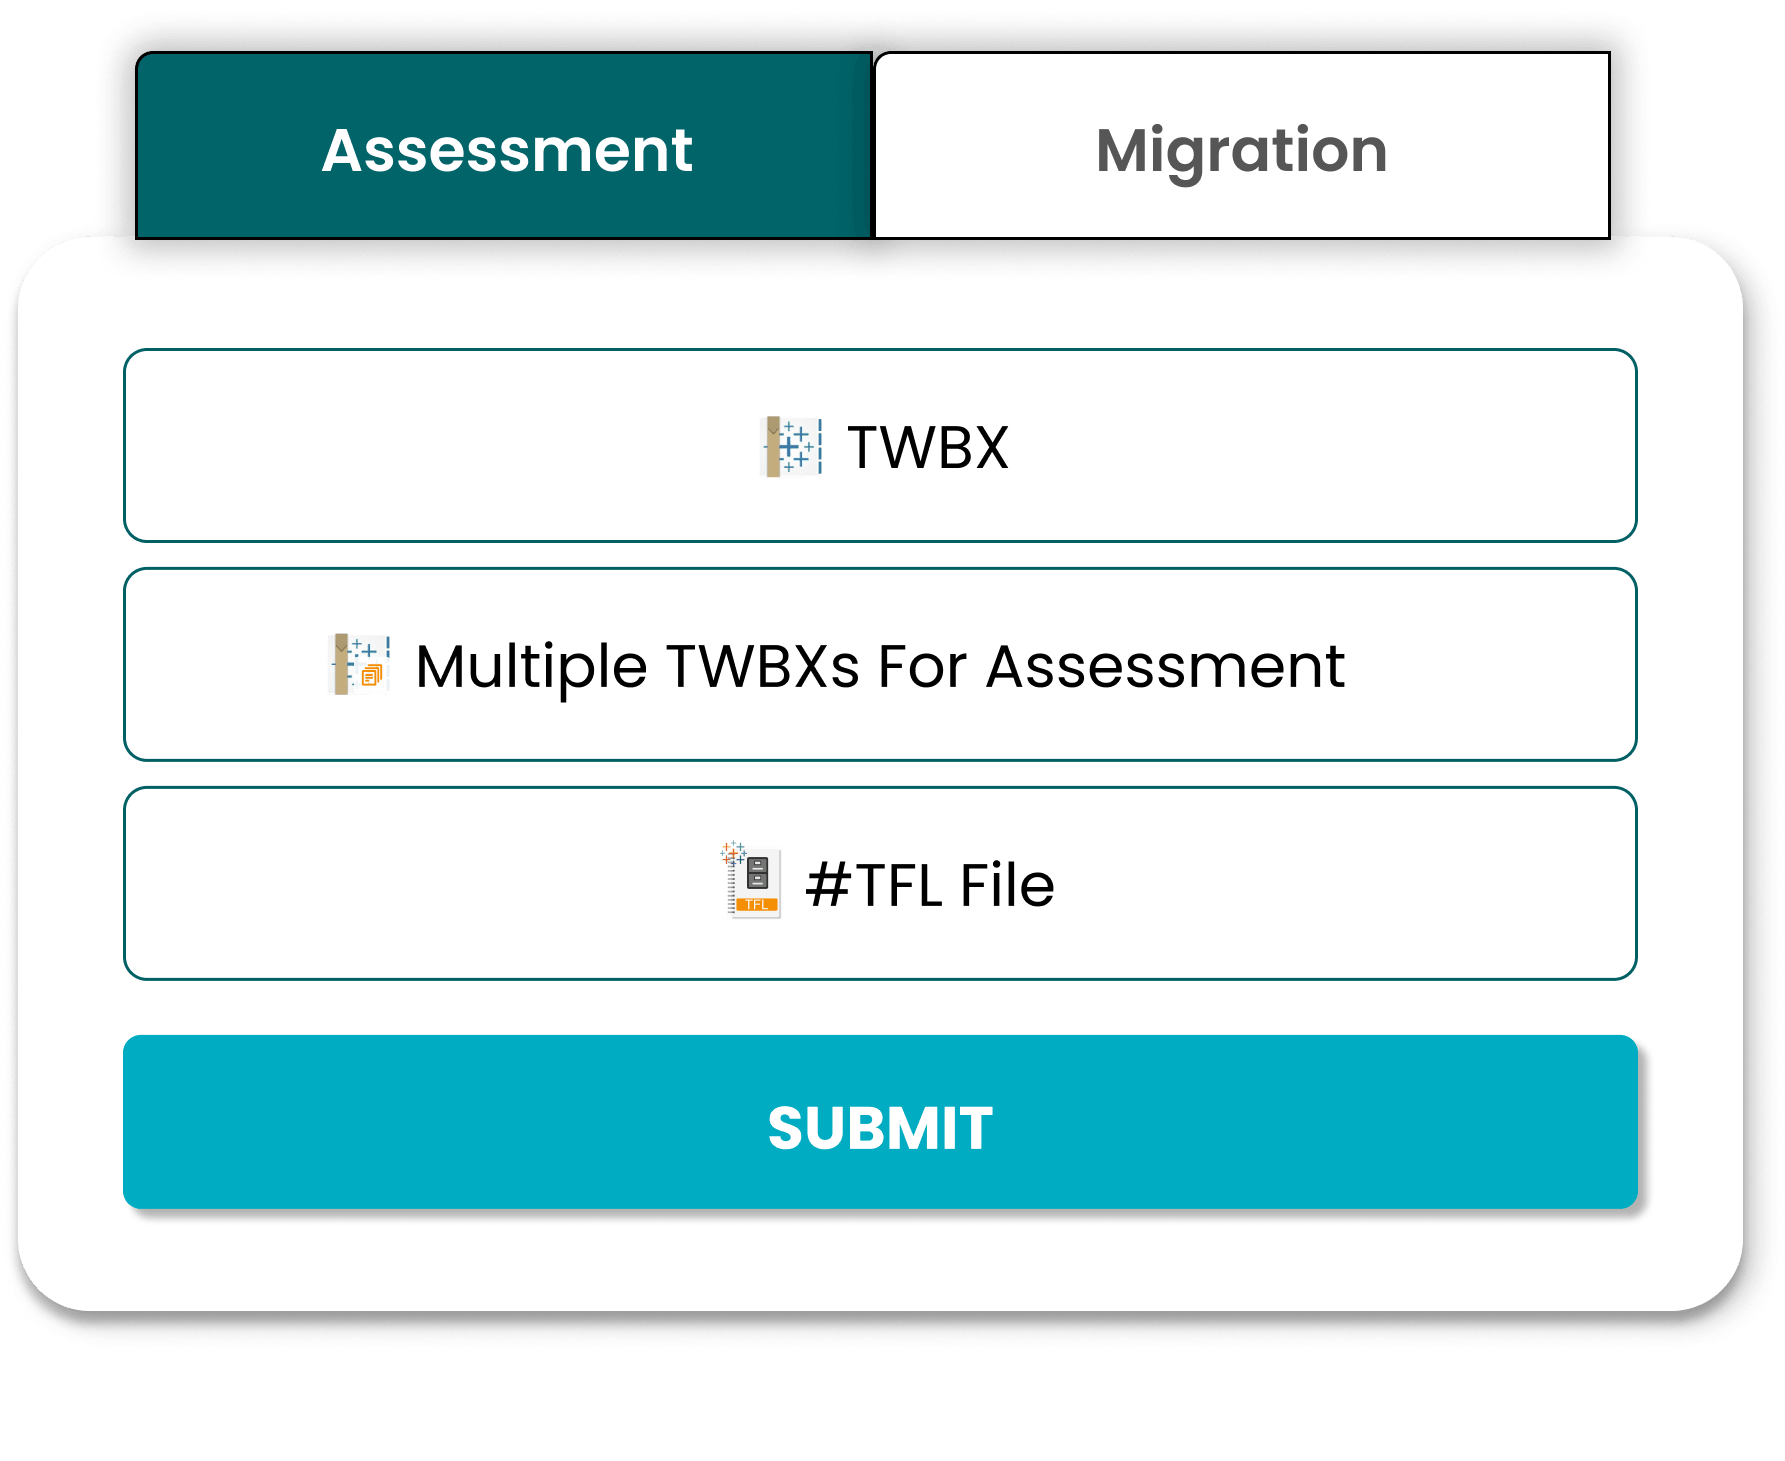
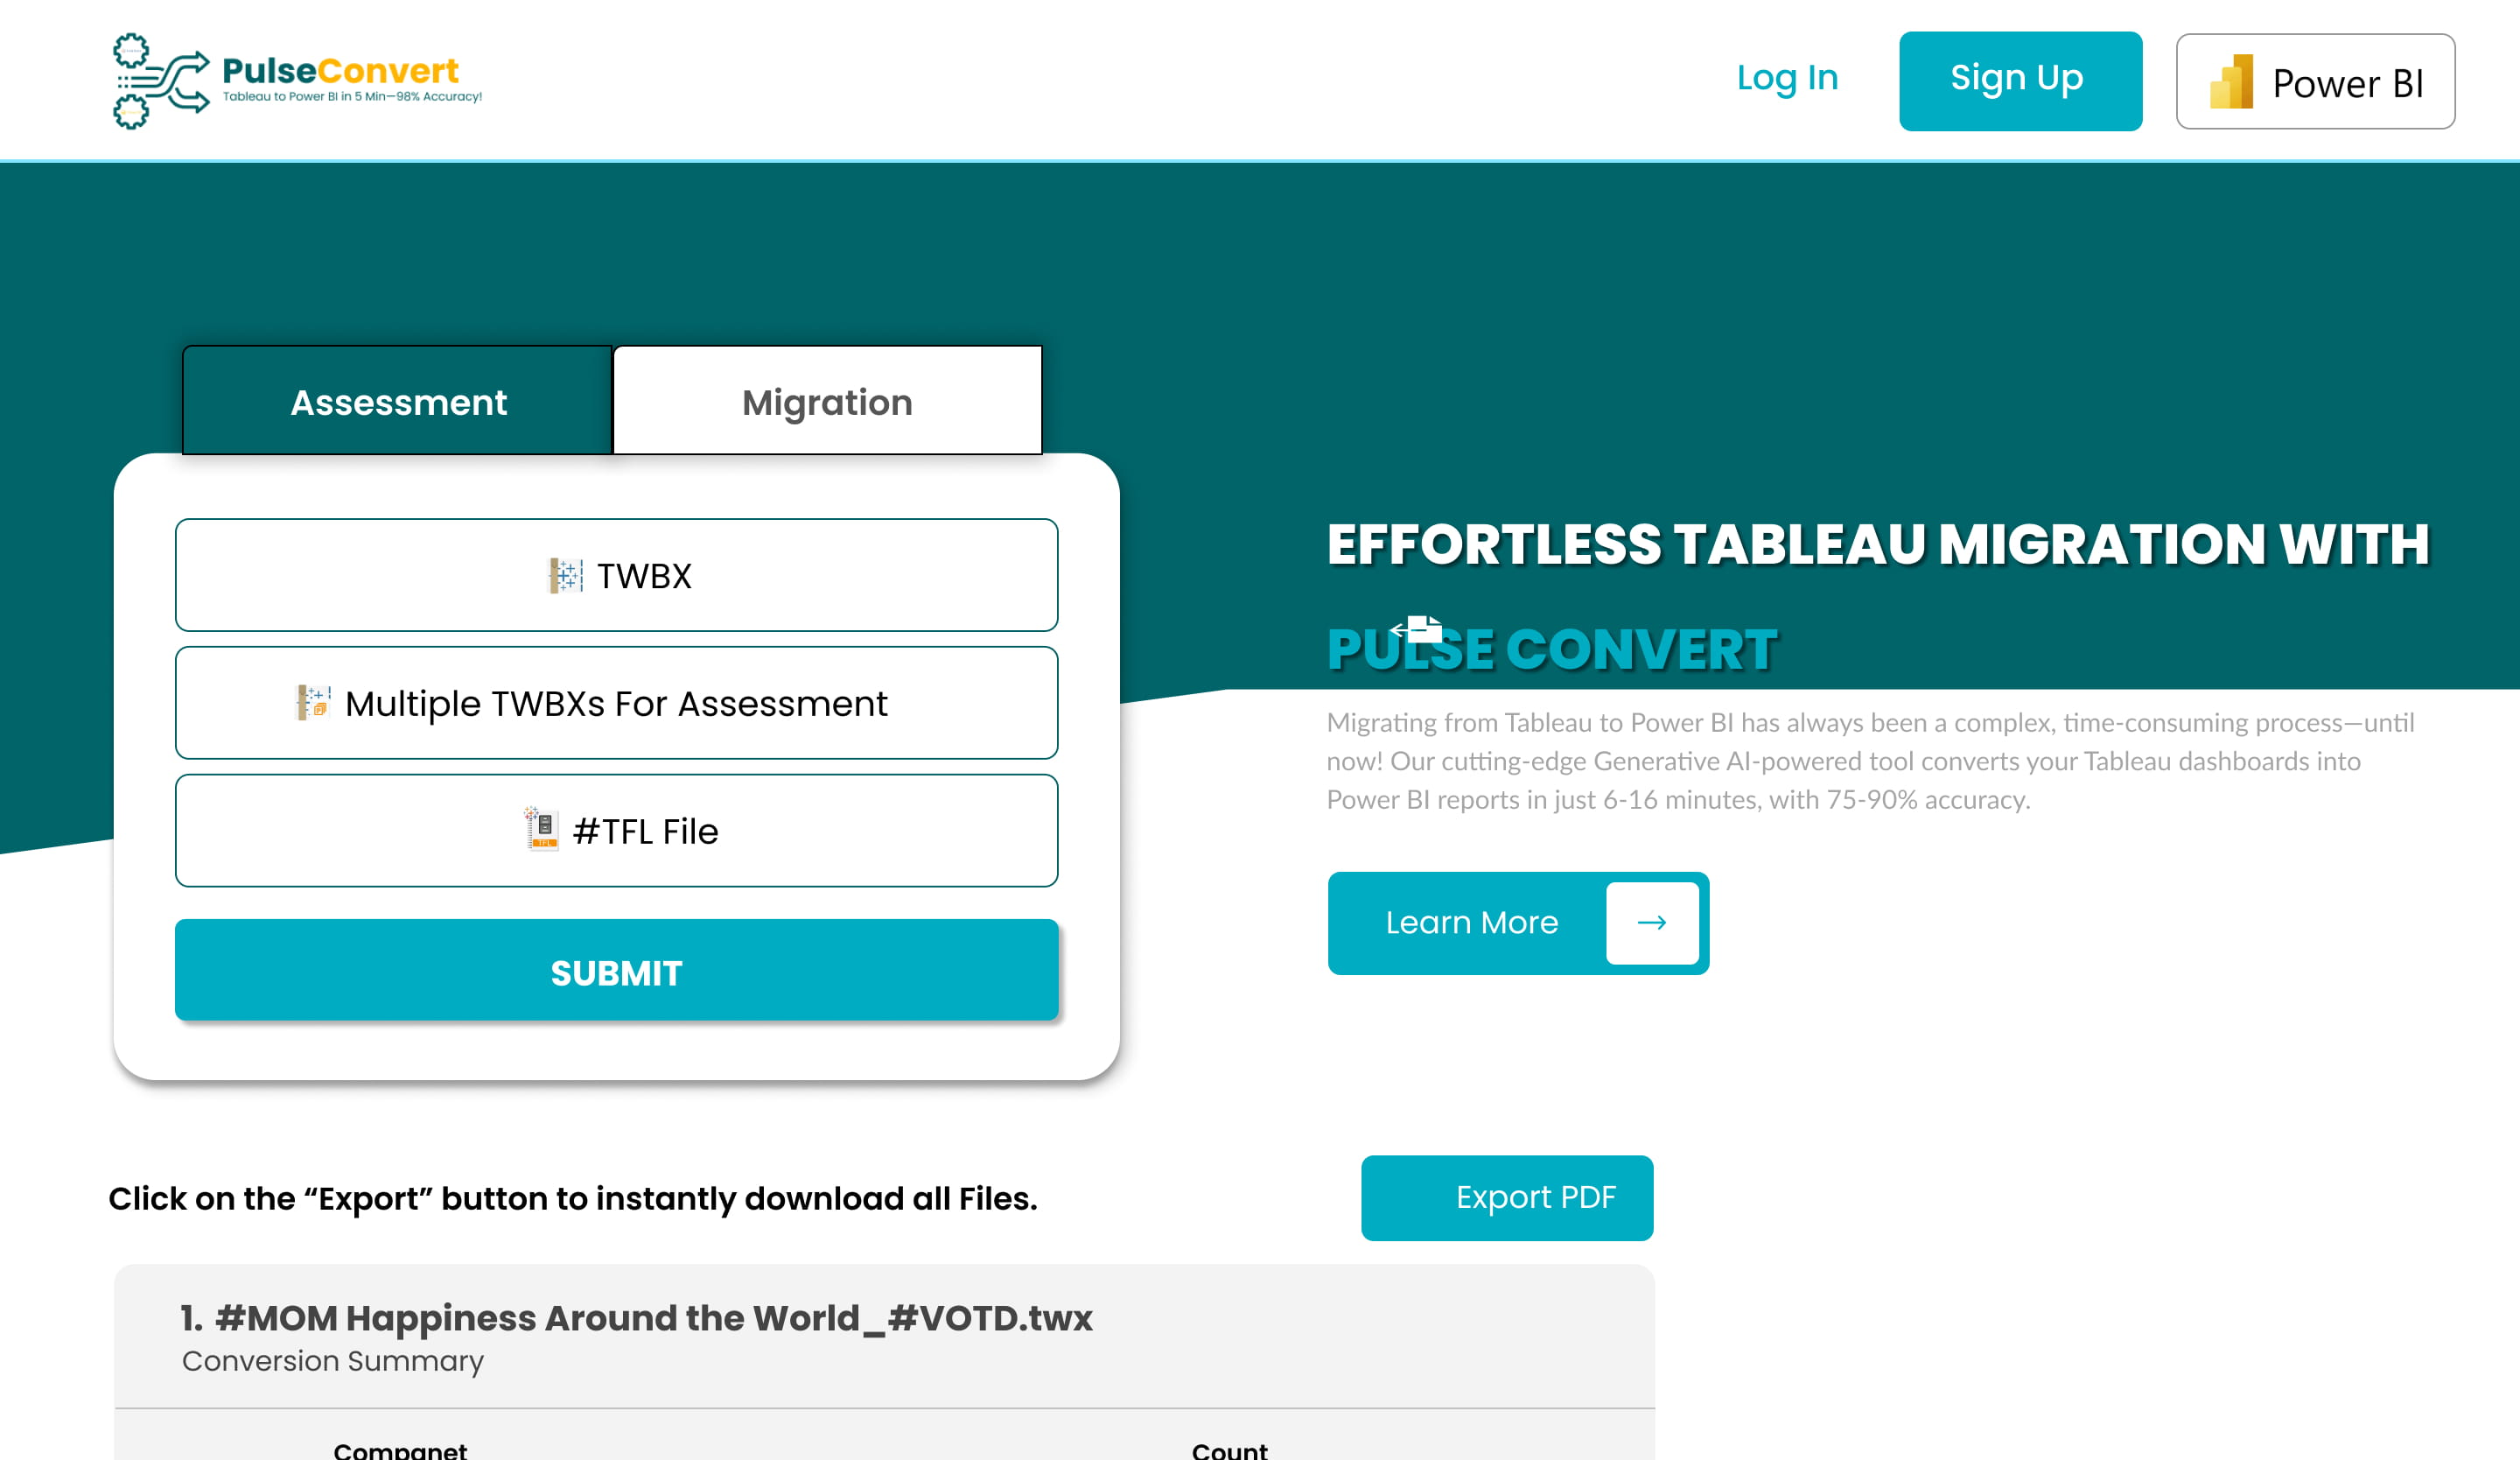
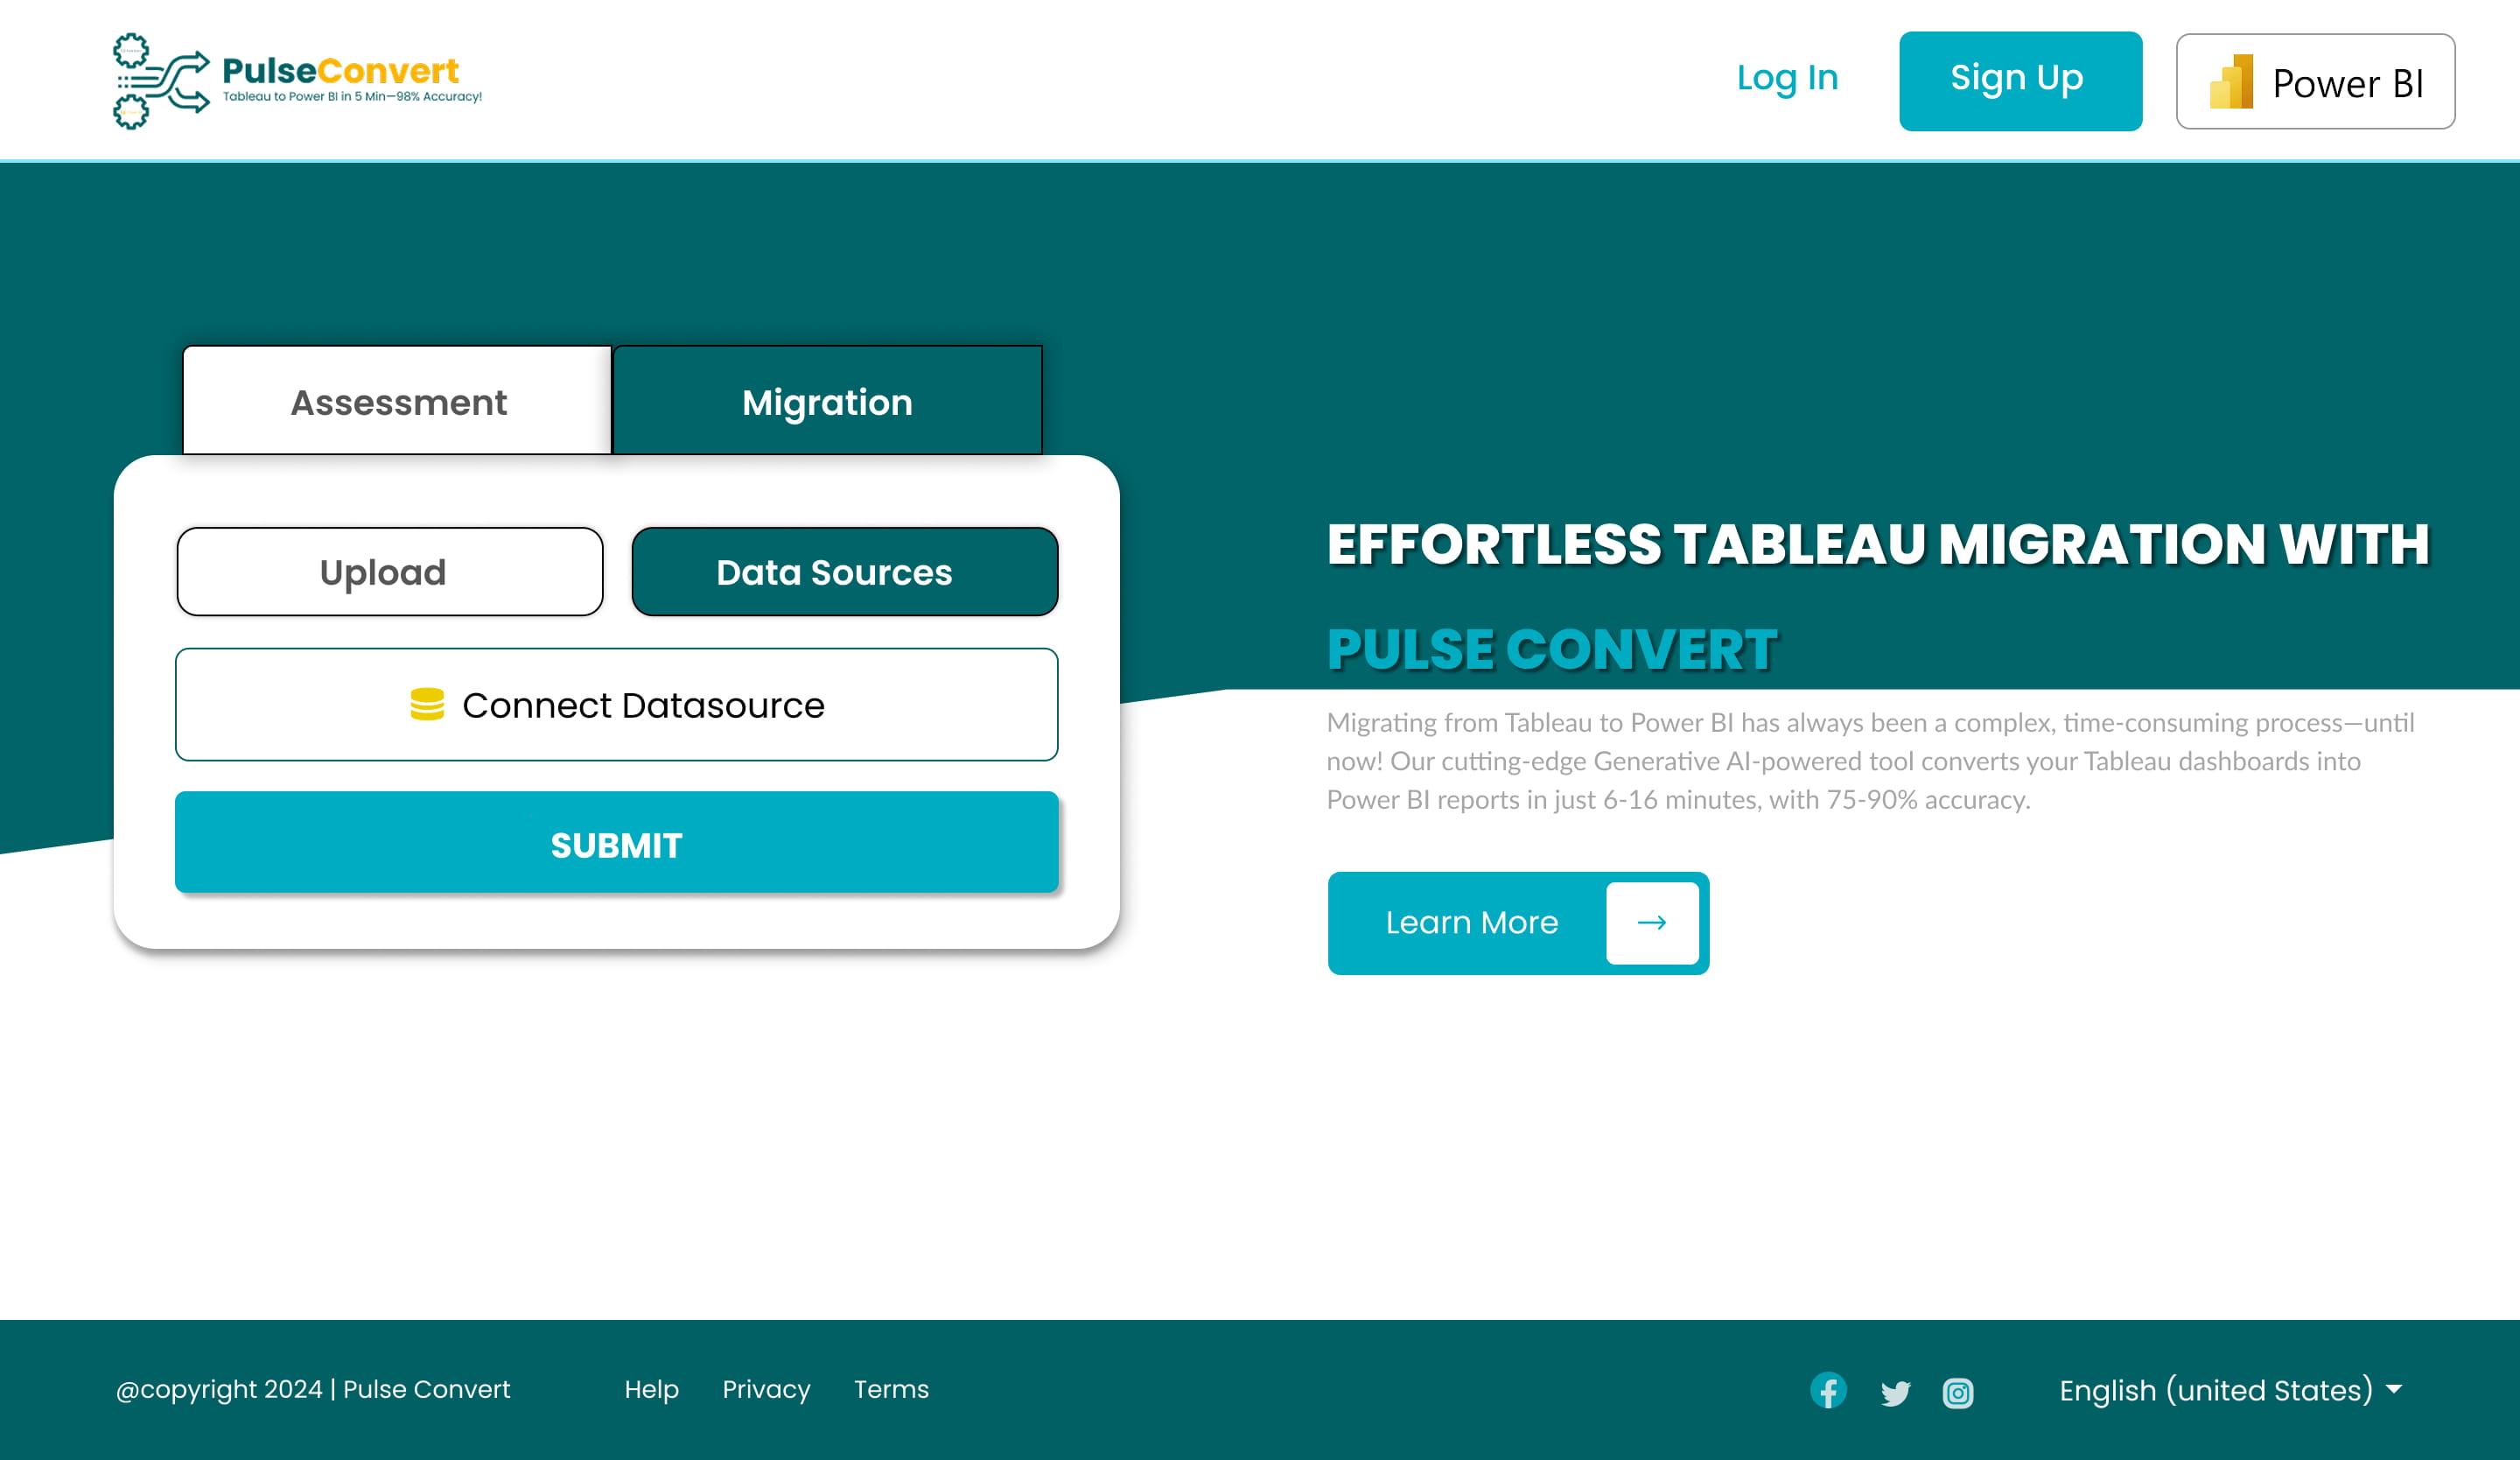
Screenshots
Planning to migrate from Tableau to Power BI?
Book a free assessment and get a 5-dashboard proof of concept.


